

A Portfolio
Investments are typically analyzed singularly, and collection is considered a “portfolio.” This is a mistake because, while each investment has its own risk and return profile, the combination represents one single combined investment. In other words, a portfolio should be thought of as one investment with its own risk-adjusted return profile. That is, an investment with its own risk-adjusted return. It has dynamic components which consist of each investment within the portfolio. But a portfolio should not be viewed as a collection of investments with different risks.
In thinking about where to invest, one of the most important components is to first think about the industry or sector where the company competes. It is important to target specific industries that are worth the investment. A great company within a mediocre sector is not worth the time. As an example, GE, once one of the world’s most valuable companies, has lost most of its market value because it competed in sectors, such as large turbines for energy generation, that were no longer attractive. It doesn’t matter if, according to GE’s standards, it was the number one or number two competitor in that sector. The sector is not worth the time. As it has now been shown, that matters more than how successfully one competes.
Of course, it does matter how well a company competes once you chosen an attractive sector. An example here is Nvidia, a company that not only participated in an extremely attractive sector – specialized integrated circuits for intense processing, initially focused on gaining and then artificial intelligence – it competed effectively to become an industry sector leader. As a result, its value has increased almost 10 X in the last seven years.
Different sectors have different risk components, and different companies competing within the sectors also have different risk profiles. It is appropriate to combine securities with different risk profiles, in both its sector and competitive position. Each of these companies can be thought of as a growth, defensive, cyclical, or stable investment, for example, depending on these different profiles.
Fundamentally, a successful investment strategy combines companies competing successfully in attractive sectors offering unique risk-adjusted return when combined into a single portfolio. It is this investment strategy where the risk-adjusted return is superior.
The S-Curve
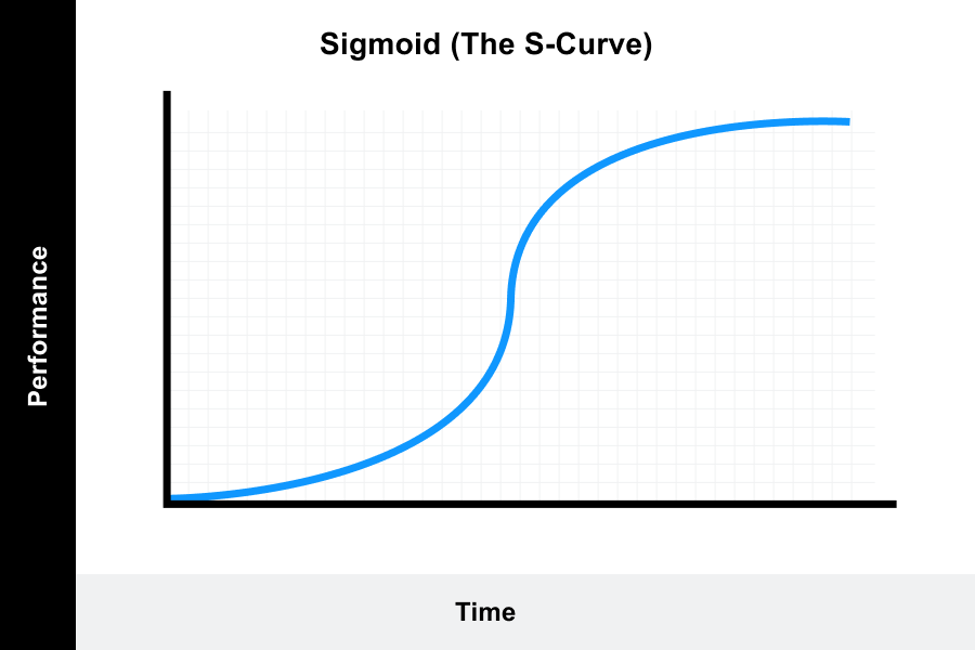
What do we mean by risk-adjusted return? A simple way to explain this is through an “S” curve, as demonstrated below. There is a relatively flat bottom increasing in degree and slope. Sometimes, the slope will increase at an increasing rate, a phenomenon known as “convexity.” We will discuss this later, but convexity is one of the key attributes to an attractive investment. But, as we can see, those returns begin to diminish as we approach a changing slope in the curve.
There is a relative flattening at the top of the curve. This is true for every investment. The timescale may be different (attractive returns might be earned for a short time or, potentially, for decades, but, returns eventually flattened). There is no escape from this phenomenon.
The attractiveness of this simple diagram is that it captures the idea of the upside or the downside associated with an investment, and where that specific investment is on this curve. Any investment can be diagrammed this way. It is very effective representation of the downside risk and potential upside return potential. If you are toward the bottom of the curve, there is little downside, but significant upside potential.
An example of this is 10-year US treasuries in 2016. The yield was 3.24%. There is essentially no downside to this investment – you are going to receive your interest and principal payments from the US government. But, given current low yields on the 10-year treasury in 2020 – around 0.5% – this investment would have made over a 30% return. That is an example of an extremely attractive risk-adjusted return. 30% return with essentially no risk is a unique opportunity.
On the other hand, an investment with more volatility may be toward the top of that curve where there is significant downside potential and not much more upside left. There may be extreme volatility causing significant increases and decreases on a day-to-day basis, but the overall trend is that the value of the investment is flattening in the risk of a significant decline is increasing and becoming more likely.
An example of this is likely to be Tesla. As of this writing, the company has had an extraordinary run up in valuation to over $350 billion. Yet, the company is barely profitable and manufactures only a fraction of the vehicles that competitors valued substantially lower produce. This current valuation for Tesla does not seem warranted, even based on the best future prospects (especially since it is worth more than most of the rest of the auto industry combined). It appears that this valuation assumes the overall electric vehicle market will be quite substantial, and that Tesla will capture a significant share of that market. However, even if the electric vehicle market turns out to be substantial, there are many well-capitalized competitors who understand this opportunity, and also grasp the technology. They established well-regarded brand names and will compete effectively over time. This kind of valuation assumes perfect implementation and a far superior competitive position that is likely to be achieved. While there may be some additional upside left, there is substantial downside where the stock may drop as much as 90% from current levels, placing this investment on the top of the S-curve.
Another investment strategy is to buy an index fund. Typically referred to as “passive investing,” is a strategy that essentially is portfolio and a single investment since the investment represents a combination of all stocks within that single index. The most popular index investment is the S&P 500 index. This is a very liquid security representing a combination of passive investing (the investor makes no choice on how the portfolio is allocated because it is defined by simple algorithm that weighs the value of each S&P 500 stock according to its market value) and moderate risk. An S&P 500 index fund is probably somewhere in the middle of this S-curve. The market probably still has more value at any given time, even though that potential can vary significantly. Market indexes, including the S&P 500, have dropped as much is 40% in recent market corrections, so there is certainly downside risk, especially given current valuations. The CAPE Index – Cyclically Adjusted Price Earnings ratio from Prof. Robert Shiller is close to an all-time high. This would indicate that there is more downside (the market index is higher up the S-curve) then upside. But the market is also dealing with historically low interest rates which make the present value of all earnings more valuable. So, given this combination of factors, it is most likely that an investment in the index today is at the middle of the risk-adjusted S-curve.
This S-curve analysis applies to any security. A combination of securities, that is, a portfolio, fundamentally, is a combination of securities that while each has its independent S-curves, the combination forms one single S-curve representing the risk-adjusted return expected for the entire portfolio. Therefore, the portfolio should be modeled as a single security.
Risks and potential change. It is important to understand the dynamic components to the portfolio’s S-curve. For example, owning Tesla at the end of 2019 would have earned a substantial return of over six times by September 2020. Therefore, the dynamic nature of that security, while certainly providing a substantial return, also changes its fundamental S-curve and therefore the overall risk-adjusted return potential for the portfolio.
Another example is Exxon Mobil. In 2008 it was the most valuable publicly traded company. Since then, it is lost 60% of its value as the energy sector continues to go through fundamental change, and incumbent competitors are vulnerable to dynamic industry forces. Exxon was at the top of the curve after returning substantial value to its shareholders. But an investor who did not understand this assumed much more risk which much less potential upside than perhaps he or she realized.
A portfolio is not a static thing and should be reassessed as valuations and risk dynamics change. The S-curve is an effective tool to understand and assess this risk-adjusted return dynamic. As mentioned above, all companies operate within industry sectors with competitive dynamics. Understanding the prospects for the sector, regardless of historical performance (i.e. Exxon), as well as understanding competitive dynamics and their impact (i.e. Tesla) is critical to understanding the true risk-adjusted return – the S-curve – an investor is assuming.